Summary
This is an illustrative scenario, not performance data from a system ACC has implemented. Monitoring objectives, thresholds, and response responsibilities need to be designed around the project's current conditions.
A common situation
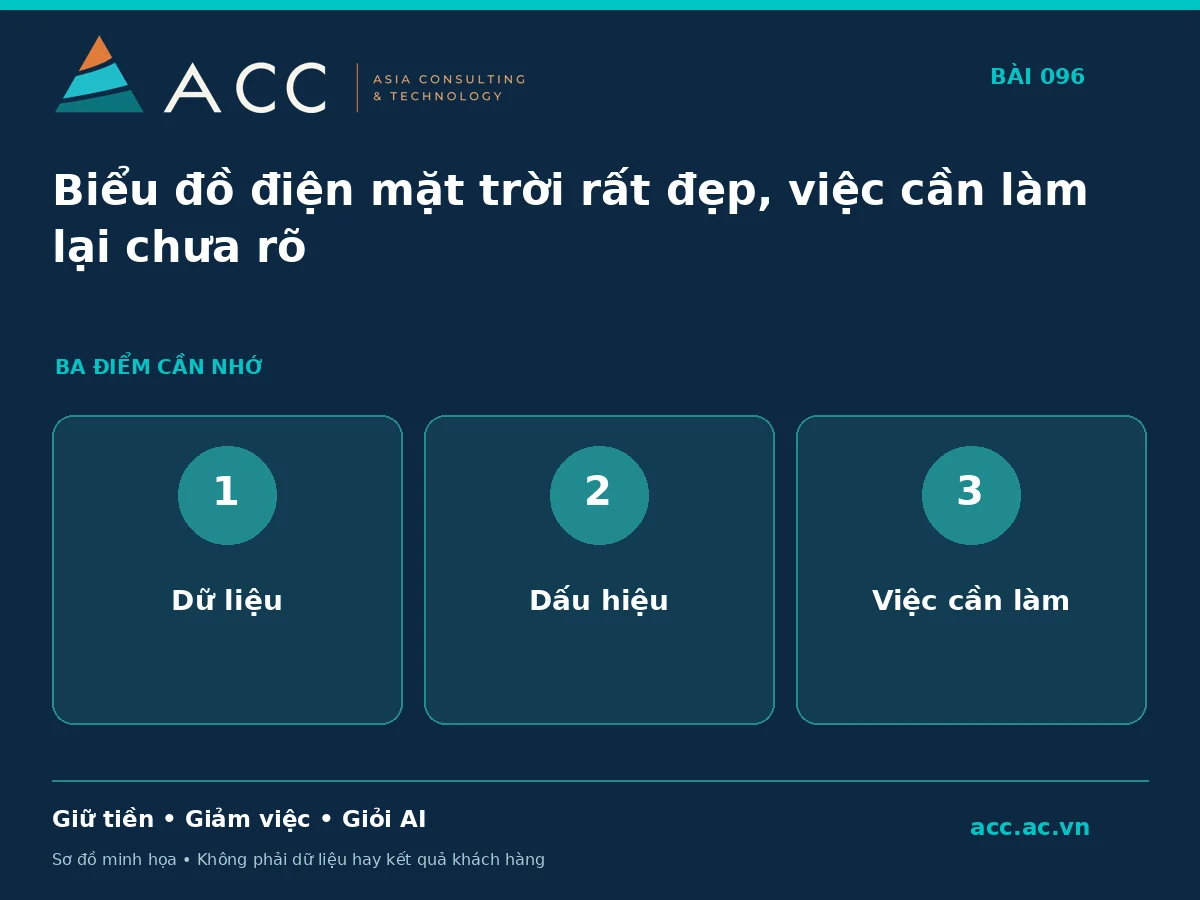
Illustrative scenario: An operator looks at real-time data but still does not know which point to check first. Multiple plotted lines do not automatically produce a decision. Start with the operational question the data needs to support.
Three steps you can try
- Choose a situation that requires a response.
- Identify the data needed for that situation.
- Link alerts to an appropriate checking step.
What to remember
This is an illustrative scenario, not performance data from a system ACC has implemented. Monitoring objectives, thresholds, and response responsibilities need to be designed around the project's current conditions.
This is a hypothetical illustration, not an ACC customer testimonial or project result.